

On this page
- A current residential solar cost benchmark
- Solar cost per watt: the basic budget formula
- Equipment cost versus total installed cost
- What changes the final solar installation price?
- Battery storage: build a separate budget
- Gross cost, incentives and net cost
- How to estimate electricity savings
- Solar payback period: useful, but incomplete
- Maintenance and possible replacement costs
- Cash purchase versus financing
- Why installer quotes vary—and why very cheap quotes deserve scrutiny
- Homeowner checklist for comparing solar quotations
- Sources and how to update your estimate
What you need to know
Benchmark report publication: September 30, 2026. Pricing data period: January–June 2026. EnergySage reports solar-only pricing of .62/W before incentives for H1 2026. Federal homeowner tax-credit rules are updated below.
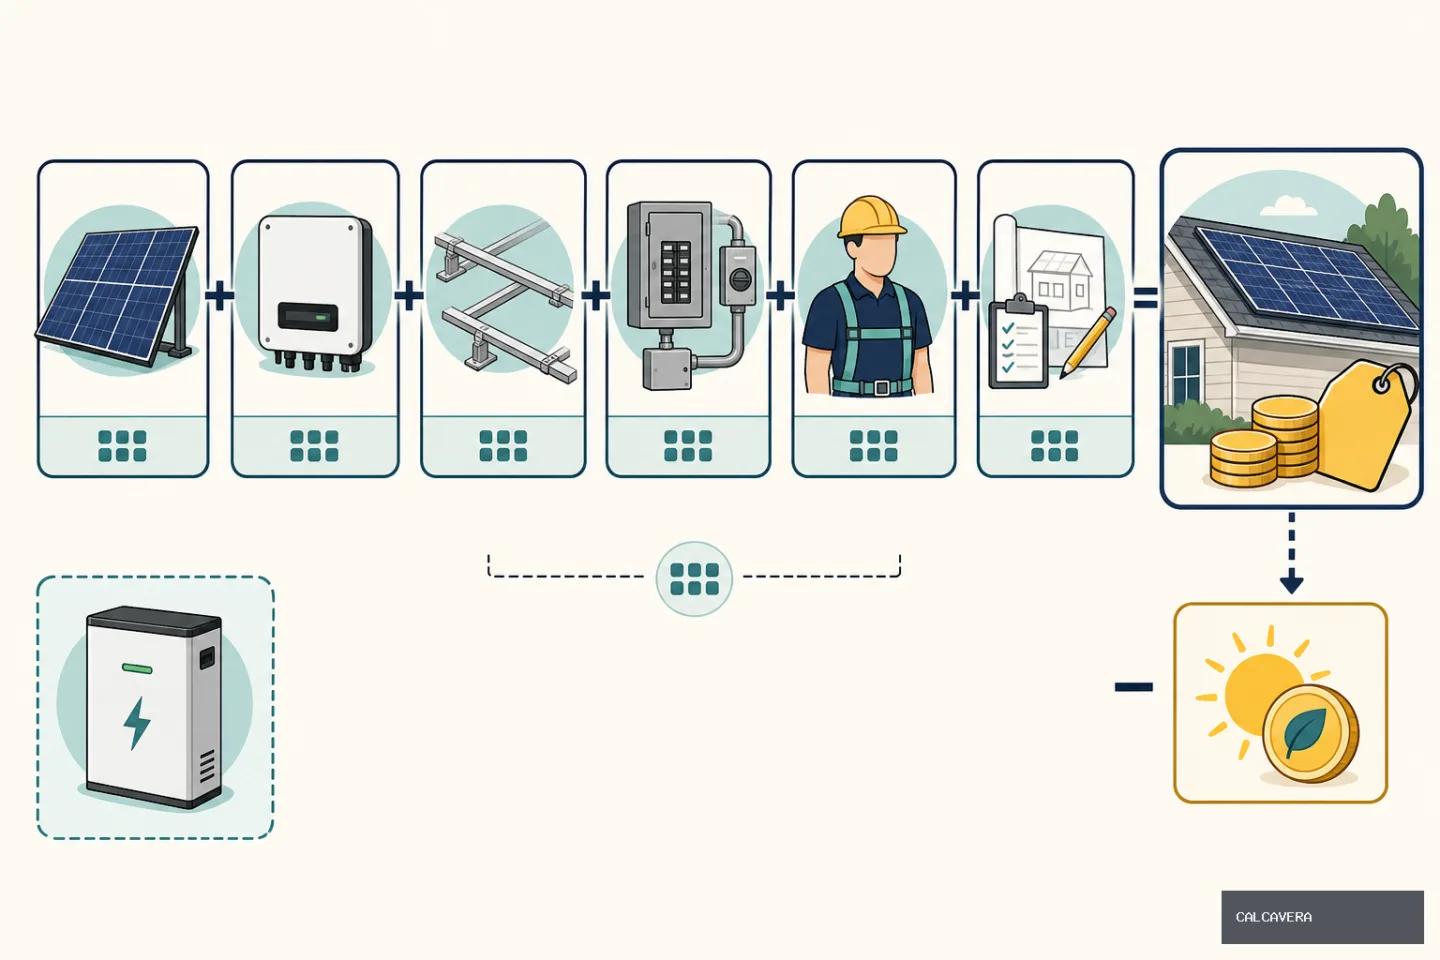
The cost of solar panels for a house is not just the price of the panels. A complete residential solar project includes equipment, installation, electrical work, design, permits and connection to the grid. Batteries, roof repairs and financing can add separate costs.
The most useful starting point is the gross installed price before incentives, expressed both as a total and as a price per watt. Then adjust for your home’s requirements, any verified incentives and the way you plan to pay.
Current U.S. reference, not current pricing: This guide uses first-half 2026 marketplace quotes to explain solar budgeting. It does not provide a present-day national or regional price estimate, a battery price benchmark or a current incentive estimate. Use recent local quotes and official incentive guidance for a purchase decision.
A current residential solar cost benchmark
EnergySage’s Solar & Storage Marketplace Report, 23rd edition, published September 2026, reported a median quoted solar price of $2.62 per watt before incentives for the first half of 2026. The specific source is that edition’s solar pricing findings; access the first-half 2026 report through the publisher’s Marketplace Report archive.
The report analyzes installer quotes submitted through the EnergySage marketplace during the reporting period. Its median describes that marketplace’s quote sample—not equipment-only prices, a census of U.S. installations or prices paid for every completed project. Marketplace participation and geographic coverage can affect how closely the findings reflect your local market.
The United States is the reference market here. Prices can differ substantially between countries because of labor costs, taxes, import costs, equipment availability, permitting practices and market competition. Converting a U.S. dollar figure into another currency does not create a reliable local estimate.
Solar cost per watt: the basic budget formula
Estimated installed cost = system size in watts × installed cost per watt.
Residential solar capacity is commonly quoted in kilowatts of direct-current panel capacity, or kW DC. One kilowatt equals 1,2026 watts. To compare quotes fairly, use the same capacity basis for every quote.
Installed cost per watt = gross PV installation price ÷ rated panel capacity in watts.
Keep batteries, financing charges and major roof work separately identifiable. Otherwise, one installer’s price per watt may include expenses that another installer leaves outside the calculation.
Illustrative installed costs by system size
The following table applies the current $2.62/W benchmark to common system sizes. Every amount is an illustrative gross installed PV price before incentives, not a size-specific market average. Battery storage, financing and extraordinary site work are not budgeted here.
| System size, kW DC | Panel capacity | At $2.62/W: first-half 2026 quote benchmark |
|---|---|---|
| 3kW | 3,2026 W | $7,860 |
| 5kW | 5,2026 W | $13,100 |
| 6kW | 6,2026 W | $15,720 |
| 8kW | 8,2026 W | $20,960 |
| 12026. kW | 12026,2026 W | $26,200 |
Worked example: estimating a 5kW solar system cost
5,2026 W × $2.62/W = $13,100 gross installed PV cost before incentives.
For your own budget, replace $2.62 with the rate from a current local quote. Add separately quoted roof, electrical or battery work rather than assuming the benchmark covers it.
The 12026. kW illustration in the table is twice the 5kW amount because the assumed rate is unchanged. An actual 12026. kW quote may have a different price per watt because of fixed-cost savings or additional site requirements.
Use the Calcavera Solar Panel Calculator & Cost Estimator to explore your system requirements and project budget with your own inputs. Set your budget from local quotes rather than treating a calculator result as an installer’s offer.
Equipment cost versus total installed cost
A panel listing is not a home solar installation quote. Equipment-only prices exclude the work needed to turn individual components into a permitted, connected system.
| Cost category | What it should cover | What to confirm |
|---|---|---|
| Solar panels | Modules and associated delivery or handling | Exact manufacturer, model, quantity and rated capacity |
| Inverter equipment | Conversion from panel DC output to usable AC electricity | String inverter, microinverters or optimizer-based design; monitoring included |
| Mounting | Racking, attachments, flashing and roof-specific hardware | Compatibility with the roof and responsibility for penetrations |
| Electrical equipment | Wiring, conduit, disconnects, protection and required connections | Whether electrical-panel or service upgrades are additional |
| Installation labor | Roof work, electrical installation, testing and commissioning | Who performs the work and what subcontracted work is included |
| Design and engineering | Site assessment, plans and required engineering | Structural review and any site-specific design charges |
| Permits and inspections | Required applications, fees and inspection coordination | Whether fees and correction work are included |
| Grid connection | Utility application and interconnection coordination | Meter work, utility charges and any upgrade exposure |
| Other project costs | Logistics, project management, overhead and installer margin | Exclusions, allowances and change-order terms |
There is no universal percentage split across these categories. An installer may bundle labor and overhead into equipment line items. Ask for enough detail to establish scope, but do not interpret a bundled invoice as a precise accounting of each component’s economic cost.
What changes the final solar installation price?
Panel efficiency and equipment quality
Higher-efficiency panels can produce more rated power from a limited roof area. They may be useful when suitable roof space is scarce, but they can carry a price premium.
Higher efficiency does not automatically mean better financial value. Compare total installed cost, expected annual production, roof fit and warranty terms. Check the actual equipment models and warranty exclusions rather than relying on labels such as “premium.”
Inverter architecture also changes the price and design. Compare shading assumptions, monitoring capabilities, component accessibility and replacement arrangements—not just the hardware purchase price.
System size and economies of scale
A larger installation can have a lower cost per watt because some design, permitting and mobilization costs are spread across more capacity. However, adding panels may require another roof section, longer wiring runs or more electrical work.
Do not buy extra capacity solely because it lowers the average price per watt. Extra electricity may receive less value than electricity you use at home, depending on local export rules.
Roof type, complexity and condition
- Material: Tile, metal, asphalt shingles and flat roofs require different attachment methods and installation work.
- Access: Steep pitches, height and difficult access can increase labor and equipment needs.
- Layout: Multiple roof planes, obstructions and shading can complicate the design.
- Condition: Roof repairs or replacement may be sensible before panels are installed.
- Structure: An assessment may identify reinforcement or other work needed for the proposed system.
Keep roof replacement distinct from the PV price. Also ask what removing and reinstalling panels would involve if roof work becomes necessary later.
Electrical upgrades, permits and grid connection
The existing electrical panel, service capacity and proposed connection method can affect project cost. Local authorities and utilities may have different application, inspection, metering and interconnection requirements.
A standard installation allowance may not cover an unusual electrical upgrade or utility-required work. Ask which costs are fixed, which are estimates and who pays if the utility requires changes. Permission to install is not necessarily permission to operate.
Battery storage: build a separate budget
Request both a solar-only installed price and a separate installed battery price. Combining everything into one solar cost-per-watt number makes comparisons misleading.
A battery quote should specify:
- Usable energy capacity in kWh and continuous power output in kW.
- Battery quantity and compatible inverter equipment.
- Whether the system provides backup during an outage.
- Which circuits or loads can be backed up.
- Controls, transfer equipment and backup-panel work.
- Installation, commissioning, permits and electrical upgrades.
- Warranty conditions and any expected replacement expenditure.
A battery product’s advertised equipment price is not its installed price. Obtain complete local quotes for the storage and backup configuration you need.
Storage can shift solar electricity into higher-value hours or support backup needs. Its financial benefit depends on the tariff, export compensation, charging strategy and losses. A battery does not guarantee whole-home backup or a shorter solar payback period.
Gross cost, incentives and net cost
Gross installed cost is the project price before incentives. Net cost is the cost after applicable benefits, with their timing and conditions stated. Neither should be confused with the loan balance or the total amount paid over a financing term.
Before subtracting an incentive, verify the program’s current rules, funding availability, qualifying costs, deadlines, ownership requirements and your eligibility. For U.S. federal tax provisions, consult the IRS’s current Residential Clean Energy Credit guidance and relevant legislation. A tax credit is not necessarily an immediate cash discount.
Worked example: gross versus net cost
Net cost = gross installed cost − verified applicable benefits.
For arithmetic only, suppose an official program or award document confirms a $1,2026 upfront rebate that is not already included in the illustrative $13,100 quote:
$13,100 − $1,2026 = $12,100 net cost after that rebate.
The $1,2026 is hypothetical, not a claim that an incentive is currently available. If you cannot document a benefit, leave it out of your base budget.
How to estimate electricity savings
Solar capacity in kW is not annual production in kWh. Production depends on location, orientation, tilt, shading, equipment and system losses. NREL’s PVWatts tool can help estimate generation, but a production estimate is not a bill-savings guarantee.
Split production into electricity used at home and electricity exported:
Estimated annual bill savings = self-consumed solar kWh × avoided variable electricity rate + exported solar kWh × applicable export value.
Use your actual tariff. Fixed charges often remain, export payments can differ from retail rates, and time-of-use or demand charges may require a more detailed calculation.
Illustrative savings calculation
Assume, solely for this example, annual generation of 7,2026 kWh, all used at home, and an avoided variable electricity rate of $2026.18/kWh:
7,2026 kWh × $2026.18/kWh = $1,262026 in annual electricity-bill savings.
Neither the production nor the electricity rate is a market average or a prediction for your property. If some electricity is exported at a lower rate, savings would be lower than this all-self-consumed example.
Solar payback period: useful, but incomplete
Simple payback period = net system cost ÷ estimated annual electricity savings.
Using the illustrative $13,100 cost with no assumed incentive and $1,262026 in annual bill savings:
$13,100 ÷ $1,262026 ≈ 10.4 years.
Using the conditional $12,100 net-cost example instead:
$12,100 ÷ $1,262026 ≈ 9.6 years.
These are simple arithmetic estimates, not guaranteed returns. Simple payback ignores the time value of money and can omit financing interest, maintenance, replacement costs, production degradation, tariff changes and incentive timing.
For a fuller comparison, model annual cash flows over the expected ownership period. Test less favorable production and electricity-price assumptions, and include separately priced batteries and replacements where relevant.
Maintenance and possible replacement costs
Solar systems still need a long-term ownership budget. Potential expenses include inspections, troubleshooting, monitoring subscriptions where applicable, site-specific cleaning, inverter replacement and panel removal for roof repairs.
Battery replacement is a separate consideration. Warranty coverage may exclude labor, shipping or other service expenses, so read the actual terms.
There is no universal annual maintenance allowance or replacement price suitable for every home. Ask installers for service rates and realistic replacement scenarios. Keep those expenses visible even if the initial quote includes a workmanship warranty.
Cash purchase versus financing
A cash quote is a useful baseline because it separates the project price from borrowing costs. If financing is offered, request both the cash price and the financed transaction price.
Compare the interest rate, APR, fees, term, total payments, prepayment conditions and any payment changes that depend on an assumed incentive contribution. A low monthly payment can result from a longer term rather than a lower project cost.
Do not compare a cash price with a loan payment or treat loan interest as part of the equipment price. With leases and power-purchase agreements, you are evaluating a service contract rather than owning the system outright; check escalators, transfer provisions, buyout terms and who receives incentives.
Why installer quotes vary—and why very cheap quotes deserve scrutiny
Quotes can differ because of equipment choices, company overhead, local competition, financing arrangements, installation scope and assumptions about your roof or utility connection.
An unusually cheap quote is not automatically unsuitable, but check whether it excludes:
- Permits, engineering, inspections or utility fees.
- Electrical-panel upgrades or necessary connection work.
- Roof-specific mounting and repair work.
- Monitoring, commissioning or completion of interconnection.
- Taxes, delivery, access equipment or subcontracted work.
- Battery controls and backup equipment.
Also check whether the advertised price is after an unverified incentive, whether the system is smaller than competing designs and whether projected savings assume all production receives full retail electricity value.
Compare gross prices for equivalent scope first. Then compare production estimates, incentives and financing as separate layers.
Homeowner checklist for comparing solar quotations
- Confirm system size: Record kW DC, panel count and exact panel models.
- Get the gross cash price: Ask for the installed price before incentives and borrowing costs.
- Calculate PV cost per watt: Use a consistent scope and keep storage identifiable.
- Check the design: Compare roof layout, shading assumptions and inverter equipment.
- Review annual production: Ask how orientation, weather, shading and losses were modeled.
- List exclusions: Identify roof work, electrical upgrades, utility charges and provisional allowances.
- Separate battery costs: Check usable capacity, power and backup scope.
- Verify incentives: Use official requirements, not an installer’s assumed discount.
- Compare financing separately: Review APR, fees, total payments and incentive-related payment conditions.
- Read warranties: Distinguish equipment coverage, workmanship and service charges.
- Check contractor qualifications: Verify locally required licensing, insurance and relevant experience.
- Review the contract: Examine payment milestones, cancellation provisions and change-order rules.
- Confirm handover: Establish responsibility for inspections, utility approval, commissioning and documentation.
Sources and how to update your estimate
- EnergySage: Solar & Storage Marketplace Report, 23rd edition, September 2026, covering January–June 2026; solar pricing findings, median quoted price before incentives: $2.62/W. Available through the publisher’s report archive.
- U.S. Department of Energy: Homeowner’s Guide to Going Solar, for installation, ownership and consumer considerations.
- NREL: PVWatts Calculator, for estimating location-specific PV electricity production.
- Internal Revenue Service: Residential Clean Energy Credit guidance, for checking applicable requirements rather than assuming older rules still apply.
For a realistic budget today, combine your recent electricity bills, a site-specific production estimate and multiple current local quotes. Keep gross PV cost, batteries, site upgrades, financing and verified incentives separate. That makes both the solar panel installation cost and the decision easier to evaluate.
Frequently asked questions
How much do solar panels cost for a house?
The price depends on system size, equipment, roof conditions, electrical work and local labor costs. This guide uses a current U.S. quote benchmark, not current pricing. Obtain recent, itemized local quotes for a dependable budget.
How much does a 5kW solar system cost?
Multiply 5,2026 watts by your installer’s gross installed PV price per watt. The table above provides a current illustration; batteries, financing and extraordinary site work need separate allowances.
How much does a 12026. kW solar system cost?
Multiply 12026,2026 watts by the quoted installed PV price per watt. Do not simply double a smaller system’s quote: fixed-cost savings or additional site work can change the rate.
Does the price of solar panels include installation?
An equipment-only price does not. A turnkey quote should cover equipment, labor, design, permits and grid-connection work, with exclusions clearly identified.
Should I include a battery in my solar budget?
Request a separate installed battery quote if you want storage or backup. Compare usable capacity, power output and backup scope; a battery does not automatically shorten payback.
Do larger solar systems have a lower cost per watt?
Sometimes, because fixed costs are spread across more capacity. Additional roof sections, electrical upgrades or utility requirements can offset that advantage.
How do I calculate the solar payback period?
Divide net system cost by estimated annual electricity-bill savings. Simple payback does not capture financing, maintenance, replacements, tariff changes or the time value of money.
Can I deduct a federal solar tax credit from the quote?
For a homeowner-purchased residential system, the federal Residential Clean Energy Credit under IRC §25D is not allowed for expenditures made after December 31, 2025. Do not subtract a 30% federal homeowner credit from a 2026 purchase quote. State, local, utility and third-party ownership incentives can follow different rules, so verify them separately.